Where to start finding the blind spots in your AI adoption
I push code to our codebase most weeks, and almost none of it shows up in our ticketing system. As head of product, I iterate on designs in Claude Code and open pull requests straight from there.
I’m not the only one. More and more people outside engineering, designers and marketers included, are committing code. A lot of that work never gets a ticket, so anyone relying on tickets to see what the team is doing never sees it.
I brought this up in our recent webinar, From hidden work to unproven spend: the five blind spots undermining your AI adoption, which I co-hosted with Aaron Beals, our CTO. Aaron opened with our own numbers. When Flux’s engineering team adopted an agentic development framework in late 2025, median weekly deployment frequency rose 14.5% right away, then climbed to 42.1%. Median lead time rose 29.3%, and median change failure rate doubled. The team had to rebuild its code review process to keep up.
My pull requests and our numbers point to the same problem. Boards and CEOs are asking engineering leaders whether their AI investment is paying off, and the systems they’d normally use to answer assume humans working at human speed.
What engineering leaders keep telling us
Over the past year, Aaron and I have talked with a lot of engineering leaders, across industries and company sizes. The question we hear most is some version of this: is our AI bet paying off, and can we prove it?
A few lines from those conversations stuck with us.
One VP of engineering had already given up on their ticketing system as a source of truth. Their line: “Jira is as good as who updates it.” So the team started going straight to the code, before they’d ever heard of Flux.
A VP of software engineering at a large enterprise told Aaron, “Token spend tells me nothing.” His real question was what his teams were getting for that spend.
Another leader put it even more precisely: “Before I measure ROI, I need to measure trust.” He wanted to hand maintenance work to an automated, agentic workflow, and he had no way to prove that workflow was reliable enough first.
Five blind spots, each with its own check
We kept hearing about gaps like these, so we organized them into five blind spots:
- Velocity theater: commit and pull request volume rises, and shipped value doesn’t move with it. For the median team in CircleCI’s 2026 data, feature-branch throughput rose 15% while main-branch throughput fell 7%.
- Review debt: reviewer capacity can’t scale with AI-accelerated output, and the load lands primarily on a few senior engineers. In our AI Code Generation Reality Check survey, 79.6% of respondents spend at least 10% of their time on code review.
- Quality drift: complexity and risky dependencies build up, then surface as incidents or rework.
- Hidden work: large efforts like refactors and architecture shifts never touch a ticket, so they never show up in ticket-based reporting.
- Unproven spend: leaders make spend decisions with no provable link to delivered value.
You can diagnose each one on its own. An organization can be strong on one and exposed on another, and that changes over time. A good test for each: do you have thin data, biased or incomplete data, or a reliance on people to report their own work accurately?
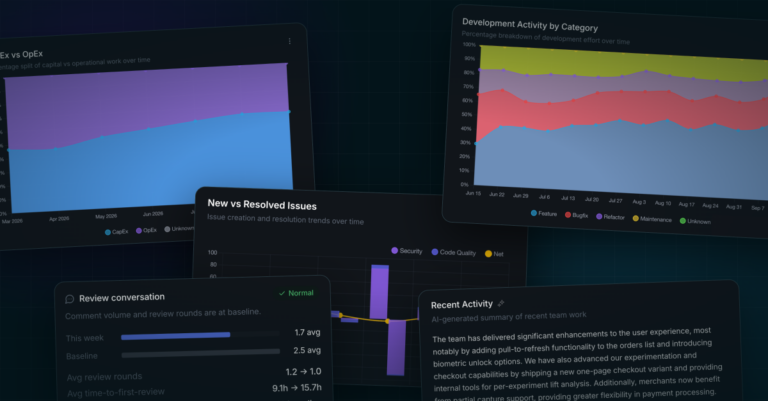
In the webinar, Aaron showed what review debt looks like using example data. On the surface, it was a good quarter: merges were up 22% over the previous period. But one team, the heaviest AI users, had pull requests that roughly tripled in size, and time to first review spiked. Reviewers were asking for splits and questioning generated code, and review bots added up to four comments per pull request for authors to triage. The typical pull request was fine. The slow tail came from large AI-generated changes.
Ted Julian, our CEO, walked through the framework in a recent post, and our five blind spots page has a summary you can review with your team.
As usual, some of the most compelling questions during the webinar came from our attendees, and we’re sure you share some of them.
Questions from engineering leaders
We got more good questions than we had time to answer. Here are the ones we took live.
1. Where do we start? I’m interested in figuring out our blind spots, but I’m not sure how.
You’re in good company. The leaders we talk to are solving this in different ways, building it themselves or working with vendors, and they agree it’s a problem worth solving.
Start where your data is weakest. Look for anywhere people compile the numbers by hand, through surveys, manual processes, or status reports. Look at how much you rely on tickets for engineering data. And notice where you’re guessing or estimating. Those are your likeliest blind spots.
Then make the data consistent across teams. Aaron was surprised at first by how few organizations have consistent data from one team to the next. Without it, you can’t compare teams, and you can’t figure out what one team is doing well and help another team do the same.
Finally, use it. Aaron reviews this data in biweekly engineering leadership meetings, and seeing what changed since last time has been one of the most useful parts of the meetings.
2. Where do autonomous agents or software factories fit into measuring engineering performance?
In a software factory, a spec, a set of requirements, or a bug definition goes in, and reviewable code comes out. If you read the hype, you might think every team is moving all of its work there. In reality, factories handle some share of a team’s output. They work well for some code, and not all of it.
The code that comes out still needs review, whether that’s AI, humans, or a mix. That verification step becomes even more important as you adopt an approach like this.
The metrics you already use still apply, though some probably matter more. Rework, or code churn, tells you how efficient the system is. Look at risk in aggregate. How it shifts over time, across many changes, tells you whether you’ve tuned your factory correctly and given it the right work.
Factory tools often provide some metrics out of the box. We’d admit some bias here, but you’ll want a separate system doing the measuring, so it’s uniform across your organization. A factory looks different from engineers using agentic coding tools, and you still want to measure both as closely as you can.
Either way, it’s code going into production that you’re responsible for. We heard similar questions at LDX3 New York, and covered more of them in our LDX3 recap post.
3. Why can’t I use AI to identify and fill in my blind spots?
You can, and plenty of teams have. The basics come easily: dashboards that count and measure things.
Going deeper is harder. Like people, AI doesn’t know what it doesn’t know. You need to understand where the data comes from, and if you’re missing a key system, you’re missing critical information. Asking an agent to crunch everything from scratch each time is also expensive, it’s more data than fits in a context window, and the answers won’t be consistent from one run to the next.
You also need a way to trust the results. Across the software development lifecycle, more effort is going into product judgment, verification, and validation, and your metrics need the same treatment. Out of the box, large language models (LLMs) tend to defer to you and work from what you’re doing today, without looking at history or outside standards. That’s fine for a one-time query but not great in a tool you’re relying on to make engineering decisions.
I’d add one thing from the product side, since a DIY build hits the same data problem. A common fix for missing data is asking engineers to tag their pull requests, and nobody wants to do that by hand. Friction like that produces bad data. So Flux classifies the work from the pull request data itself.
A lightweight DIY versiion is a good way to get started. If you want consistency and answers you can verify, you’ll probably want a platform.
If you have more questions, please reach out. We’d be happy to walk through them with you.
The answers are in the code
Start with one. Pick the blind spot where your data is thinnest, check it against your own commits and pull requests, and bring what you find to your next engineering leadership meeting.
The signals for each blind spot show up in the code itself, in commits, pull requests, and review history, whether or not anyone filed a ticket. My own pull requests included.
Watch the full webinar recording to see the demos and the rest of the discussion. Request a demo to discover where your own blind spots show up in Flux.