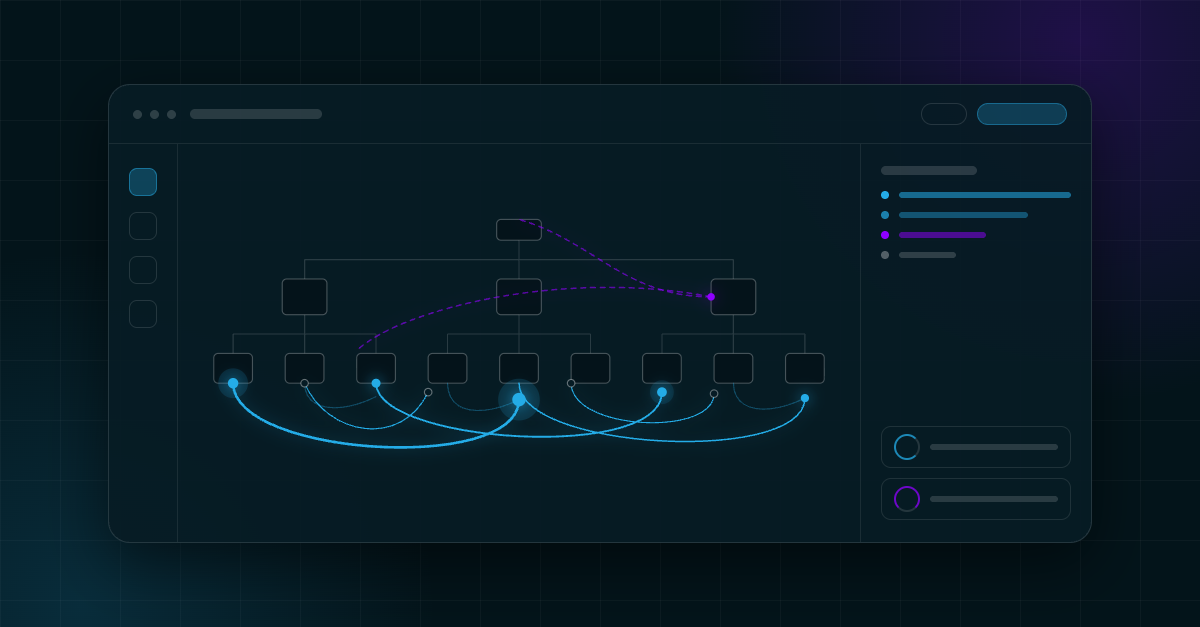
Your org chart can’t show how your engineering team actually works
Ask a VP of Engineering to draw their team’s real structure and of course they know who reports to whom. It’s much harder to tell who’s unblocking whom or who is spending a lot of time on code review and therefore less on coding new features or tackling tech debt.
But that gap is worth investigating. An org chart is great at describing reporting lines, and a ticketing system can help you understand what work is in progress right now. We rely on both of these tools to understand engineering teams, and undoubtedly they do help. But they also can’t really tell us much about how the work is actually getting done or who’s making it possible to move forward.
Mind the gap between perception and reality
What we’re missing is just as important. Do you know which senior engineer’s reviews consistently catch problems before they ship? Can you tell which two people on different teams have built a working partnership that isn’t assigned or documented anywhere? Do you know which struggling engineer found their own mentor (and who that is), helping them push their skills and understanding?
None of that is going to show up in a headcount plan or a sprint report. We think that’s a visibility problem, not a people problem, and it’s one that leaders have had to live with because the alternative was asking teams to self-report their own dynamics, which is both time consuming and frankly not likely to be very accurate.
Take code review. Every team has a review process on paper, and most leaders assume it’s roughly evenly distributed because that’s how it’s supposed to work. That assumption gets much shakier as AI tools push more code through the pipeline: reviews are rising in both frequency and volume, and that extra load lands on the same small group. In reality, a small number of people usually carry most of the real review load that’s so important. That review is what catches a race condition or a missing edge case. That work rarely shows up as its own line item anywhere. But of course it does show up as time that person didn’t spend on their own feature work, which makes their own velocity look lower than that of a peer who reviews less and ships more of their own code. So the person doing more for the team looks less productive than the person doing less. Meta’s own engineering team confirmed this directly in research published this year: reviewer workload is not evenly distributed.
Architectural review tells a similar story. Most teams have someone who has a knack for catching these types of issues. They’re quick to spot when a change won’t scale, notice an inconsistent pattern, or flag exception accumulation. Other people catch these things too, but that person notices them more often, and more reliably. They’re rarely the one getting credit for feature delivery, though. And if they leave the company or move to a new role, the gap doesn’t surface right away. It comes up months later, when something that seemed small has grown into a much bigger rewrite.
Consider this common scenario: a director reorganizes two dev squads to establish cleaner ownership boundaries, which looks like a sensible move. What the new org chart doesn’t show is that half of one squad’s review quality depended on a single engineer on the other squad, even though nobody had listed that person as a reviewer, assigned them as a mentor, or identified them as an architectural consultant. Without that information, there’s no way to account for that loss in the split. Three months later, defect rates climb on the reorganized team and nobody can identify why. The chart looked right, but the work didn’t follow the chart.
It’s not hard to imagine this scenario: a promising engineer leaves because nobody above their direct manager knew they were the reason two other teams shipped on time. Or a project that stalls for an entire quarter because the one engineer who actually understands a critical piece of the system is a junior IC three reporting layers down, and the people making the decisions didn’t think to ask them.
What not understanding team dynamics costs
When collaboration is impossible to see, it’s hard to figure out the associated costs. They might show up as attrition in your engineering org, or as a resourcing decision that looked reasonable on paper but actually hobbled one team or another. One way or another, the gap between what leadership believes is happening and what’s actually happening on the team and in the codebase is getting bigger.
Talent drain is the most expensive aspect of this. Engineers who do real, uncredited leadership work, unblocking others, mentoring struggling teammates, and catching bugs that would otherwise become an incident, eventually notice that none of that work is visible to the people who decide promotions and raises. Some stay anyway, but many don’t. People simply want to feel seen and appreciated for their contributions.
There’s also a velocity cost. When the people unblocking others or catching architectural risk get pulled onto something else, reassigned in a reorg, or are burdened by a heavy review load, the team’s overall output drops even though the overall org chart looks the same. Leaders see the slowdown in output, but they can’t see why it happened.
There’s a credibility cost too. Often, a leader can’t explain why a team’s output changed after a reorg, or why one team consistently ships cleaner code than another with the same headcount and the same tooling. The information exists. It’s just not easy to find if you aren’t looking at the evidence in your codebase.
AI tooling and agents raise the stakes
As more AI-powered coding tools and agents write and review more code, the human judgment that’s left matters even more. Despite some of the hype, someone still decides what to build, catches issues an agent missed, and mentors the engineer who is learning to work with those new tools.
Those interactions are exactly the ones that often don’t show up in a sprint report. A team leaning hard on AI-generated code still needs a human-in-the-loop to catch what the agent got wrong before code ships. If that person is invisible in your reporting, so is the risk they’re managing.
This gets harder as AI-generated code volume grows. The review burden shifts onto fewer people with the judgment to catch what an agent missed, and if a team’s metrics doesn’t capture what those people do, they don’t get credit for it. A team that looks fine based on velocity metrics can still be one departure away from losing the one person catching what the agents miss.
The record already exists; it’s in the code
The real record of how a team works is in the code: who reviews whose pull requests, who unblocks whom, which contributions ripple into other people’s work. That information already exists in every commit and every review.
Engineering leaders don’t need another dashboard that asks teams to self-report on what they’re doing, how and why. They need visibility into the collaboration already happening in the work itself, the same way they’d want visibility into velocity or code quality: derived from what happened.
The signal is already there, estate-wide, across every repository, every time someone opens a pull request or leaves a review. That’s the direction we think is worth pursuing. Let’s make it easier for leaders to see real team dynamics, spot mentorship, identify bottlenecks, and surface risk.
Request a demo to see how Flux surfaces the engineering work your org chart can’t show you.