Your org chart can’t show how your engineering team actually works
An org chart is great at describing reporting lines, but how is the work actually getting done or who’s making it possible to move forward?

Team productivity, ROI of engineering, scaling culture, mentoring, and making data-driven decisions. How to lead with clarity instead of guesswork.
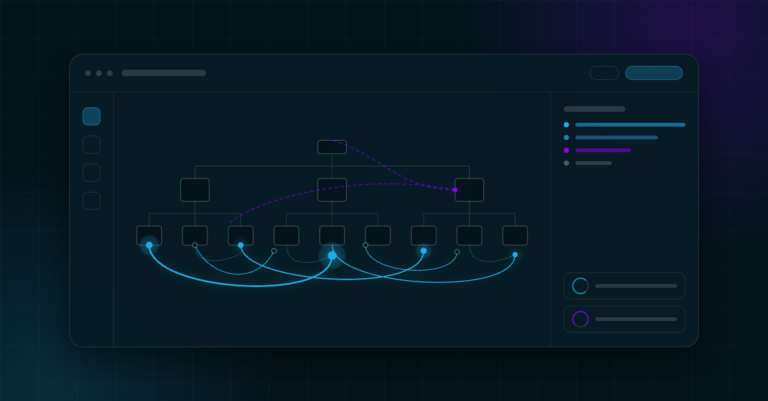
An org chart is great at describing reporting lines, but how is the work actually getting done or who’s making it possible to move forward?
A 90-day DORA metrics implementation plan, with benchmarks, common pitfalls, and how AI changes what these metrics mean.
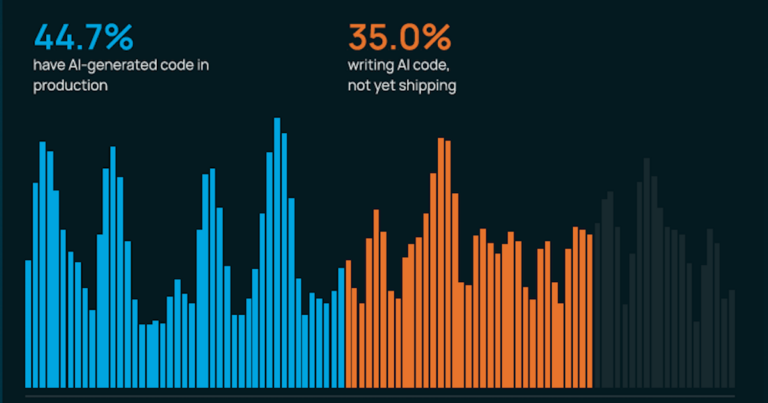
AI solved the code creation problem. Visibility is where engineering leaders win or lose next.

Ramping in a new codebase is about reading the right signals—where work is happening, what kind it is, and where things keep breaking.

Engineering intelligence for leadership roles: Get a pulse on your teams and scale visibility from Team Leads to VPs.

Flux uses code-based classification to show feature work, making it easier to justify and maximize your claims for R&D tax credits.

Discover the 4 core engineering leadership responsibilities that remain unchanged in 2026, from managing tech debt to personal ownership in the age of AI.

Learn how to evaluate engineering analytics platforms, track DORA metrics, and automate software capitalization for R&D tax credits.

Engineering leaders face rising AI expectations but flat results. Learn how code-first engineering intelligence closes the gap with real data.