Flux release notes: metrics, AI insights, team dynamics, and custom prompts
AI-accelerated development has outpaced the tools most engineering leaders rely on. The result: teams and codebases they can’t fully see.
That’s what we’re building with Flux, and the product has been moving fast.
Custom prompts
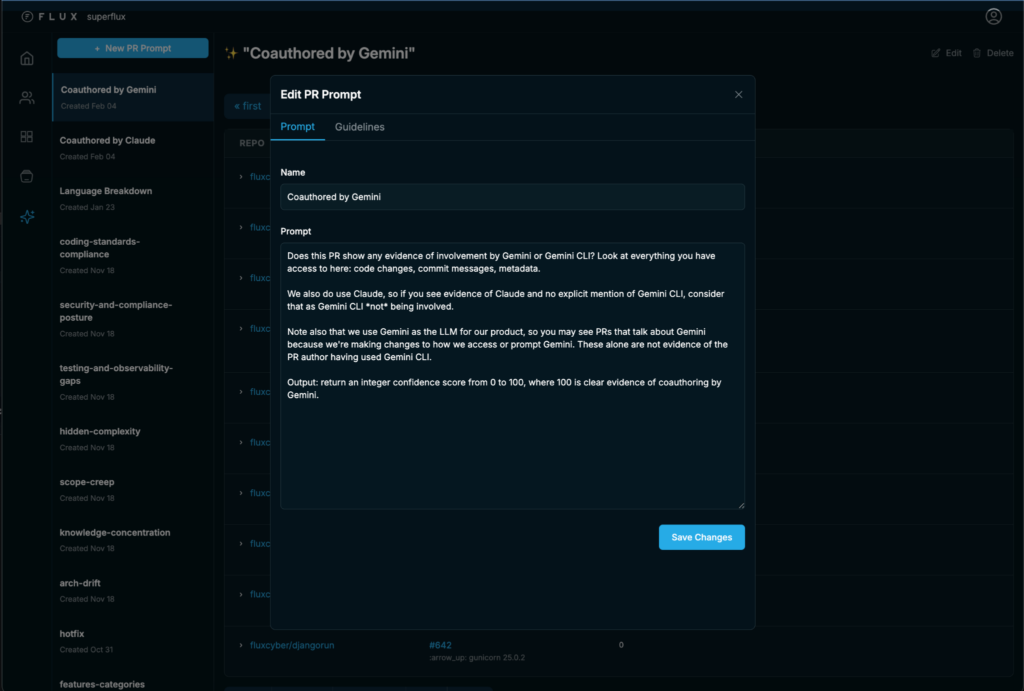
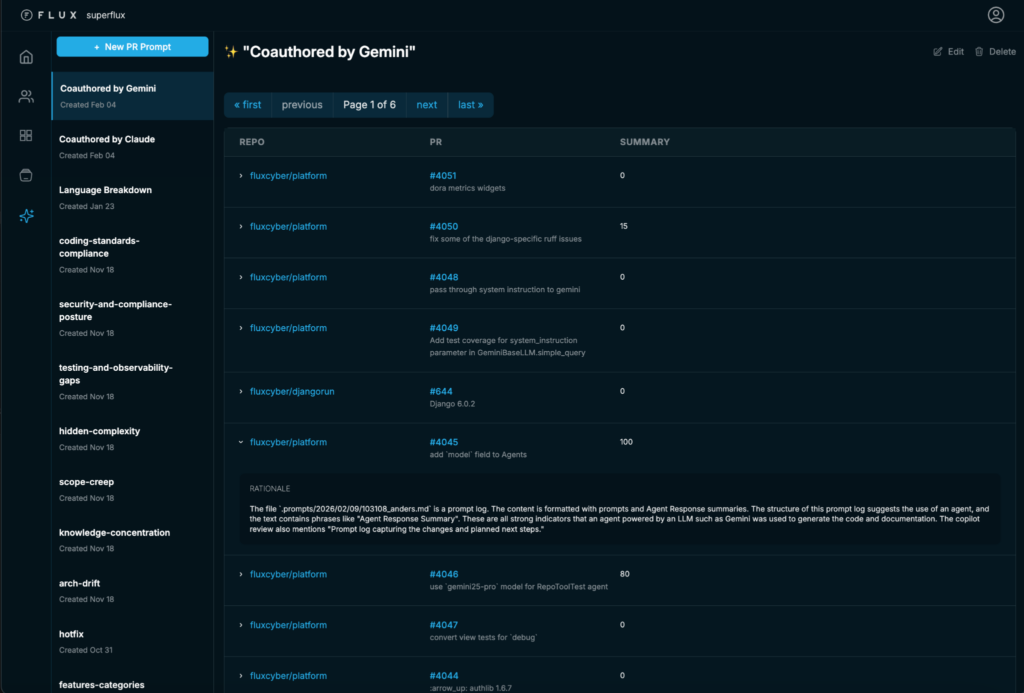
We shipped Custom Prompts earlier this year. The short version: for every PR, Flux gathers the code changes, comments, and reviews, then passes that context to Flux’s LLM with instructions you write.
Flux automatically calculates the industry standard checks and classifies the work you’re doing. The custom prompts allow you to ask questions about your codebase, such as whether there are testing gaps or whether your org’s coding standards are being applied.
Tips for working with custom prompts:
- Be specific: Tell the LLM exactly what strings to return (for example, “Respond with high_risk or low_risk”).
- Stay concise: Short, one-sentence outputs or single values are more reliable than long-form essays.
- Skip the code: Avoid asking for code snippets in the output; this keeps the analysis snappy and error-free.
- Know the limits: The prompt only sees data from the specific PR, not the entire repo or neighboring PRs.
You can find the Custom PR playspace under the Ask Flux tab in the navbar. Here’s an example from our own tenant around PRs co-authored by Gemini.
Codebase Insights: what we’ve built, and where it’s going
When we launched the Engineering Intelligence Dashboard in March, we built it to give engineering leaders a single place to see what’s actually happening across their org, without the manual overhead of piecing it together themselves.
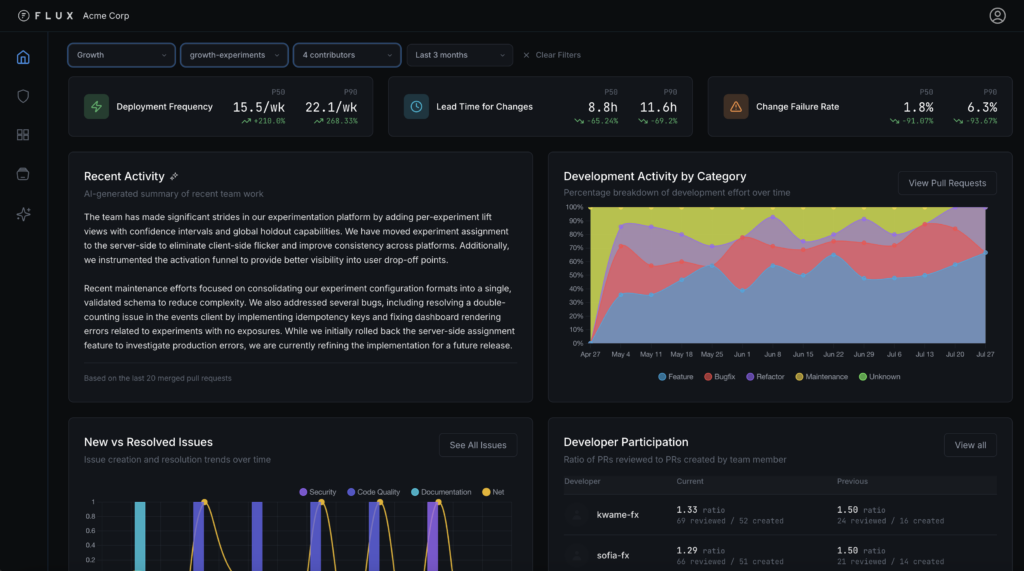
The first version of the dashboard made it simple for engineering leaders to see what was happening across their org: DORA metrics, developer participation, categorized activity, recent PRs. The Codebase Insights widget sat at the top and surfaced findings automatically.
AI-powered insights
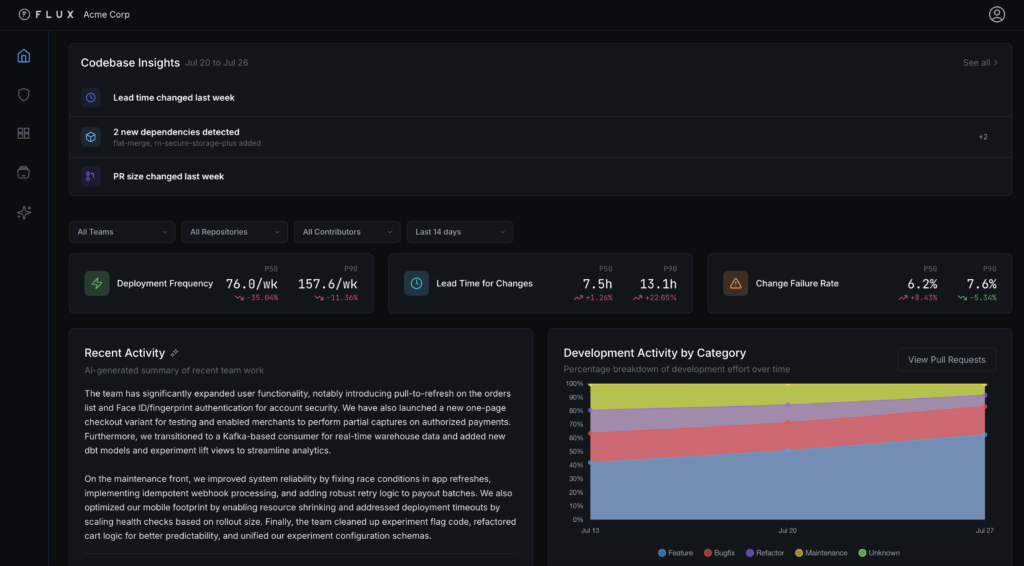
- Strategic codebase insights: automated callouts highlight trends in codebase performance, such as shifts in lead time or changes in average PR size. You get the TL;DR on your codebase without having to go looking for it.
- Recent activity: you get a human-readable summary of current progress and recent accomplishments without scanning every PR.
Precision DORA metrics (P50 & P90)
Flux shows the reality of your delivery pipeline by tracking P50 (Median) and P90 (Tail end) distributions over time.
- Deployment frequency: Track how often you hit production to measure the pace of value delivery.
- Lead time for changes: Measure the speed from first commit to merge to quantify pipeline efficiency.
- Change failure rate: Monitor the percentage of deployments requiring a revert to ensure speed doesn’t compromise stability.
Our trend calculations help you visualize trajectory and identify the outliers that slow your team down, providing a far more accurate picture than misleading averages or static snapshots.
Resource allocation & focus
- Dev activity by category: A visual breakdown of effort across Features, Bugfixes, Refactoring, and Maintenance. This information helps you identify whether maintenance is eating your innovation budget and simplify your R&D tax credit reporting with audit-ready data.
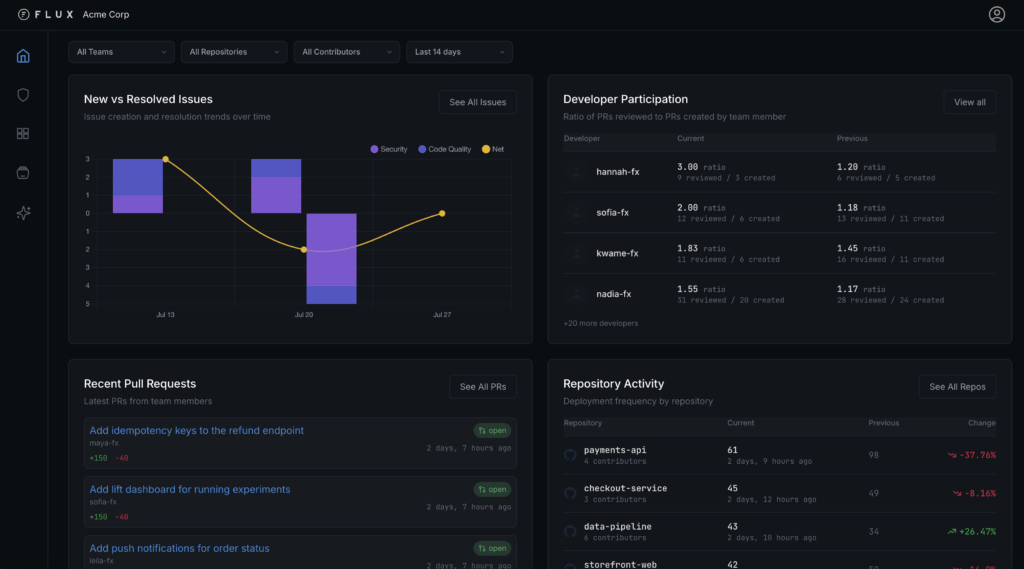
- New vs. resolved issues: A real-time comparison of issue creation versus resolution trends over time. See if your team is tackling technical debt faster than it is being created and how your progress is advancing over time.
Workflow & collaboration
- Developer participation: This analysis of the ratio between Pull Requests reviewed and Pull Requests created promotes a healthy give-and-take culture. It’s simple to identify review bottlenecks, surface mentorship opportunities, and track the adoption of team-culture initiatives.
- Recent PRs & repo activity: This real-time, consolidated feed of the latest code changes across all repositories enables you to maintain high visibility into active work cycles and team velocity.
You can also use the Global Filters at the top of the dashboard to slice codebase data by Team, Repository, Contributor, and Time Frame. Drill down from a company-wide overview to a specific squad’s performance in just a few clicks.
Team-level visibility and deeper DORA insights
Two of our most-requested capabilities went live in April: filtering your entire dashboard by GitHub team, and dedicated detail pages for each DORA metric. Whether you’re a Head of Engineering looking across the org or a Team Lead focused on your own squad, both updates are worth knowing about.
See every metric through a team lens
Your dashboard has always been great for spotting org-wide trends. Now you can zoom in. The widgets (activity summary, deployment frequency, participation ratios, and more) filter down to a specific team, so you see signals relevant to the people and work you’re responsible for.
For Heads of Engineering, this makes it easy to compare how different teams are trending and know where to focus your attention. For Team Leads, it’s a clean view of your own team’s performance without the noise of the broader org.
Teams are pulled directly from GitHub
Keep your team structure up to date in GitHub and that information will be reflected here without any additional configuration needed in Flux.
A team only appears in the dropdown if it has associated repositories and contributors. Teams without linked repos and members won’t show up, since Flux calculates metrics based on that relationship.
DORA metrics with context
The DORA metric boxes on your Flux dashboard now link to full detail pages. Click into any metric (Deployment Frequency, Lead Time for Changes, or Change Failure Rate) to get the deeper picture behind the number.
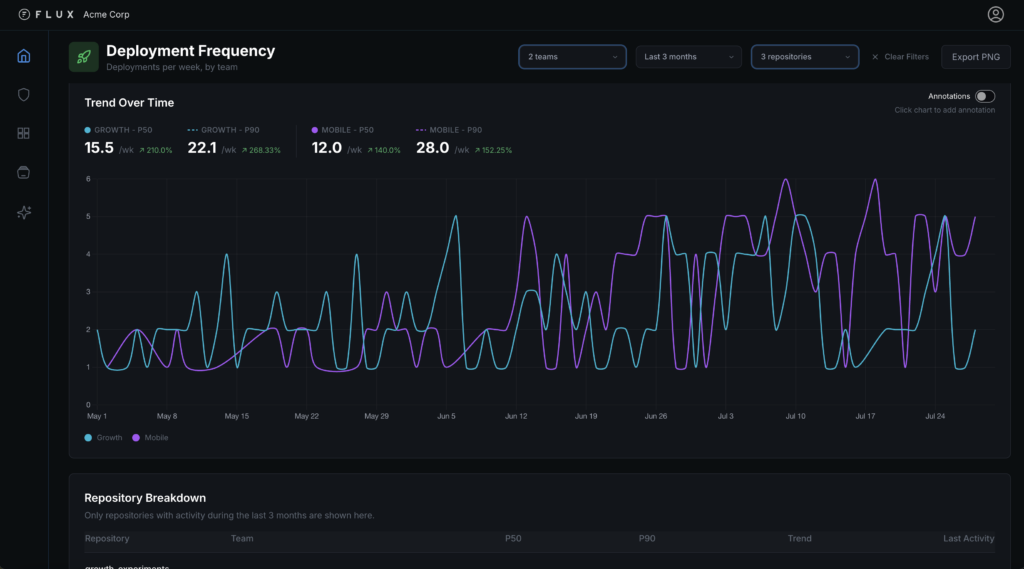
- Trends over time: see the values charted across your selected time range, so you can visualize how things are moving.
- Repo-level breakdown: check out the repo activity table to understand where activity is happening and how individual repositories are trending. This is useful for identifying bottlenecks or centers of activity.
- Team comparison: stack teams side by side on any metric to see how they’re performing relative to one another. This is a great way to calibrate expectations and have grounded conversations.
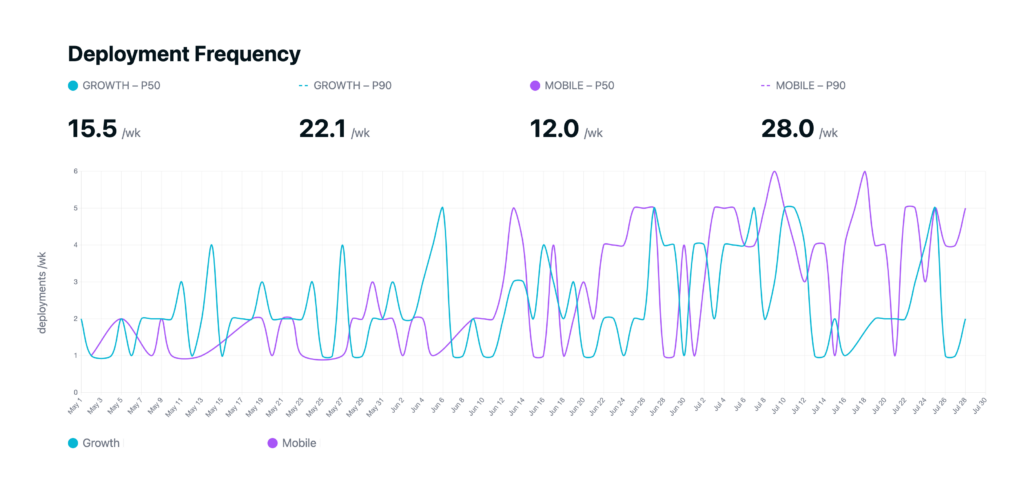
- Export-ready visuals: download any chart in light or dark mode. They’re formatted to drop straight into slides or async updates without extra cleanup.
Codebase Insights
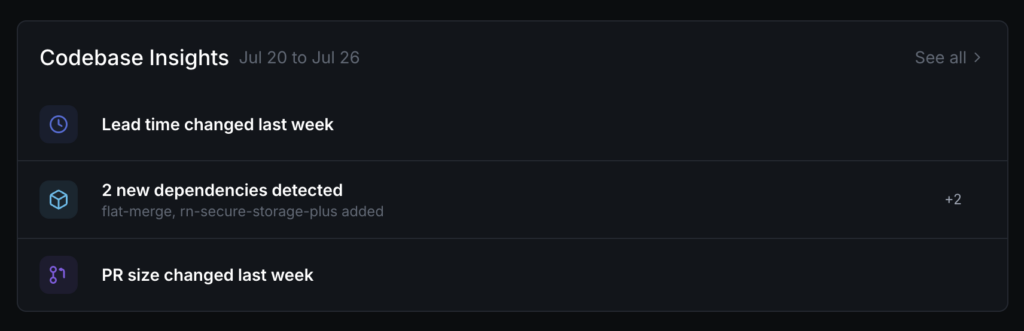
Findings in your Codebase Insights widget are more than signals; they’re now entry points. Click into any Finding to see the full picture: the trend, the numbers, the chart, and the pull requests behind it. And for Lead Time findings, there’s something new worth trying.
Finding detail pages
When Flux surfaces a Finding, such as a spike in large PRs or a shift in lead time, you’ve always been able to see that something is happening. Now you can see exactly what’s driving that finding. Click into PR size and lead time Findings in the Codebase Insights widget to open its detail page. Each one gives you the full context you need to act:
- Current, baseline, and count: see the key values at a glance: what’s happening now, what’s normal, and how many PRs are involved.
- Trend chart: a visualization of the metric over time, so you can see whether you’re looking at a blip or a pattern.
- Substantiating data: a table showing the actual pull requests behind the finding so you can see which work is moving the needle
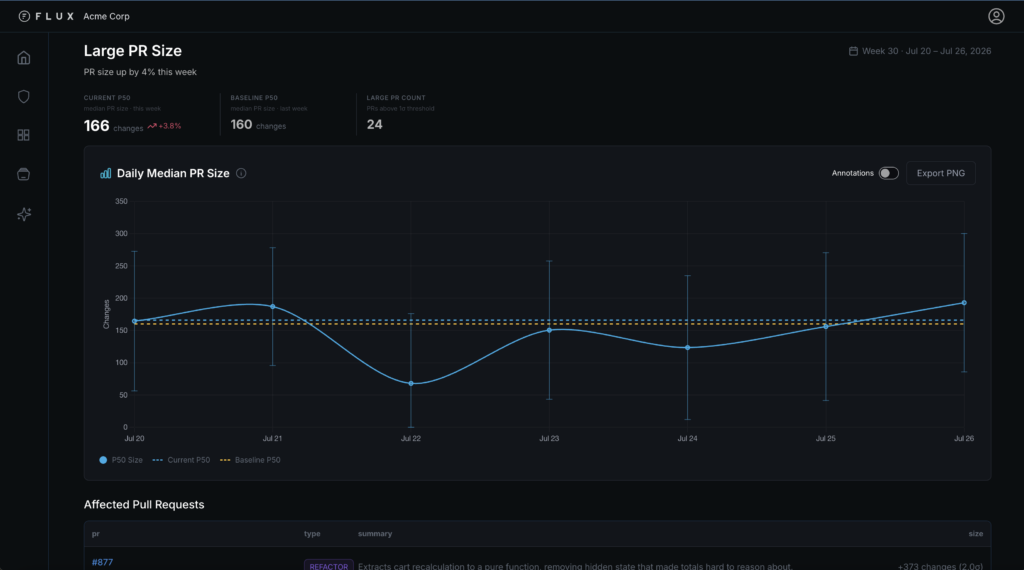
Large PR Size detail page — trend, values, and affected PRs
Analysis (beta)
Lead Time findings now include an Analysis feature. Hit the button and Flux will examine the PRs behind the trend and surface an explanation: which pull requests drove the change, what patterns contributed, and what you might consider doing about it.
Knowing lead time went up 42% is useful. Knowing it was one highly-contested PR that spent 12 days in review accumulating 43 comments, with a Friday-open, Monday-merge PR adding noise on top, is what you can actually act on.
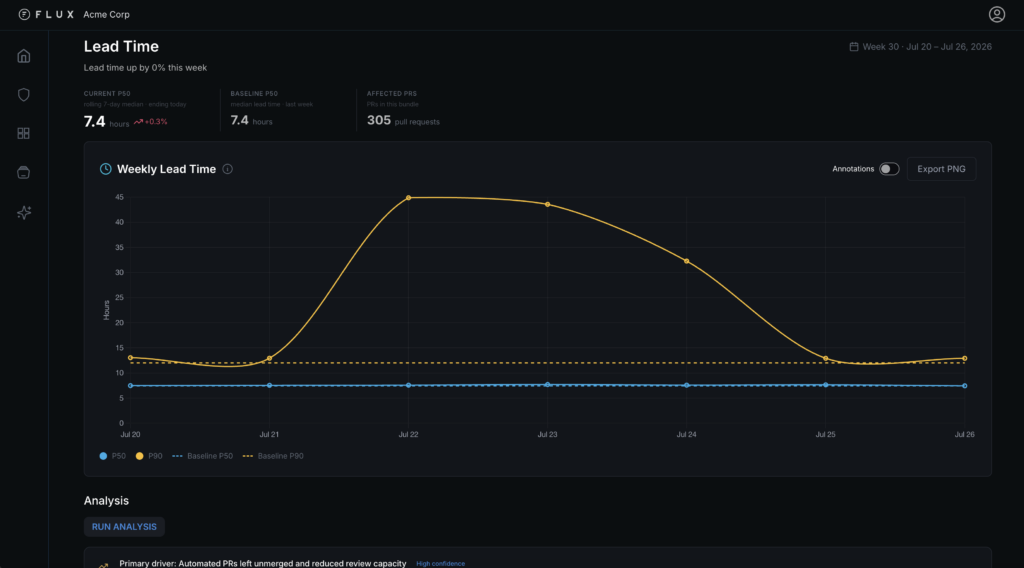
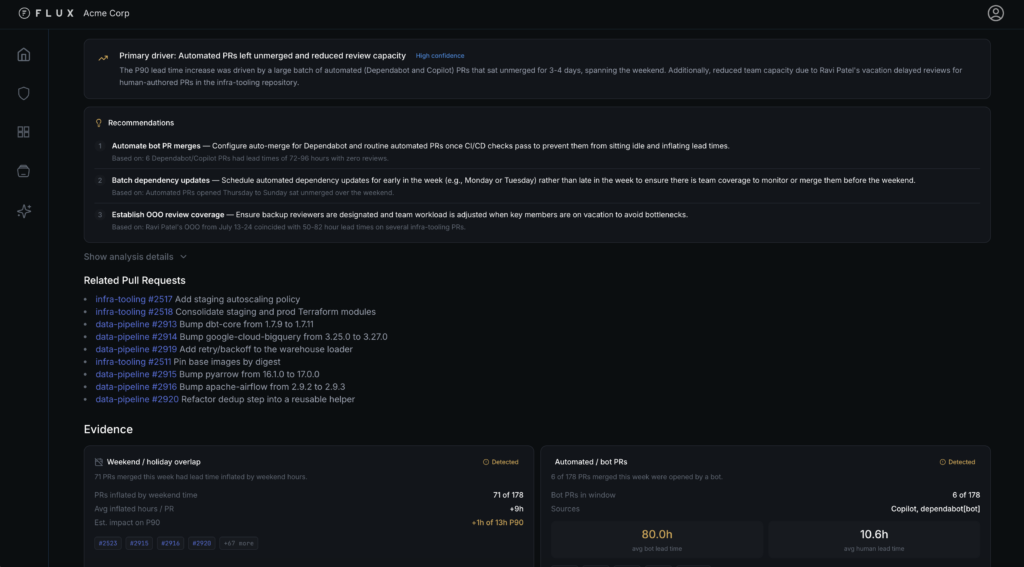
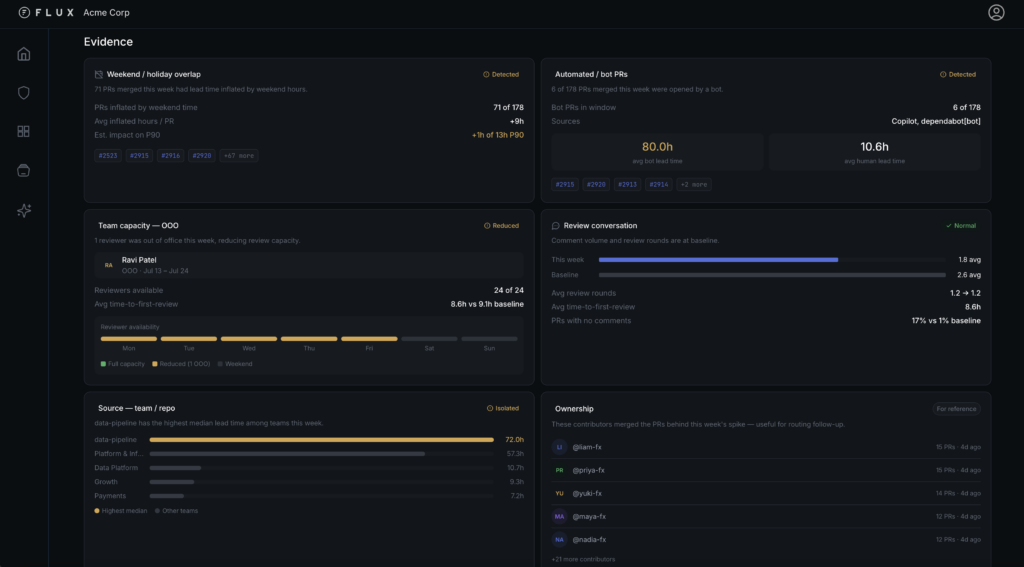
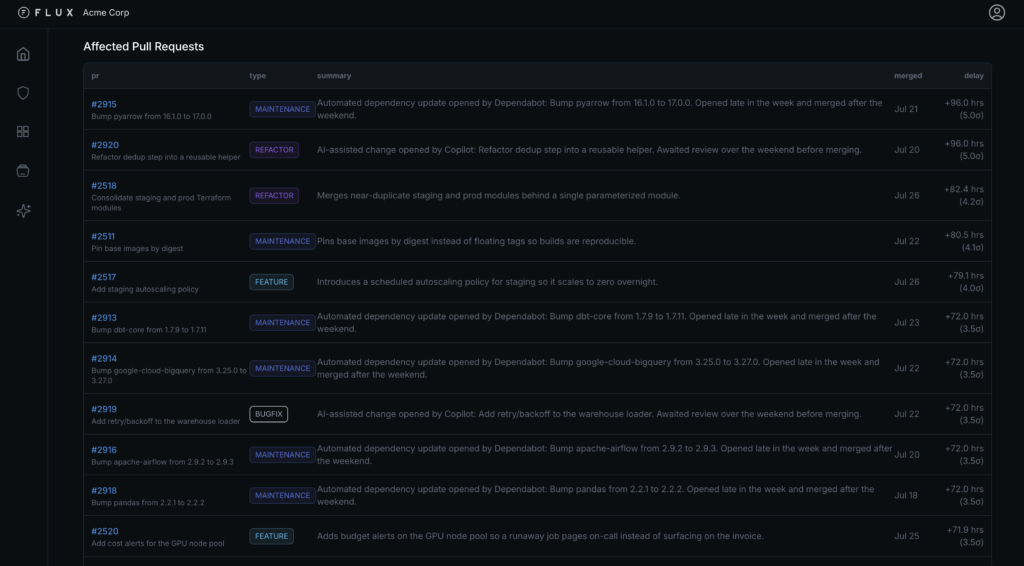
Analysis is currently available on Lead Time findings and will roll out to other Finding types soon. Results include specific PR references, contributing patterns, and suggested actions, all grounded in your actual codebase activity.
What’s next
We’re continuing to build out team-level capabilities in Flux. If there’s something specific you want to see, we’re listening.
Want a demo? See Flux in action.