Your org chart can’t show how your engineering team actually works
An org chart is great at describing reporting lines, but how is the work actually getting done or who’s making it possible to move forward?

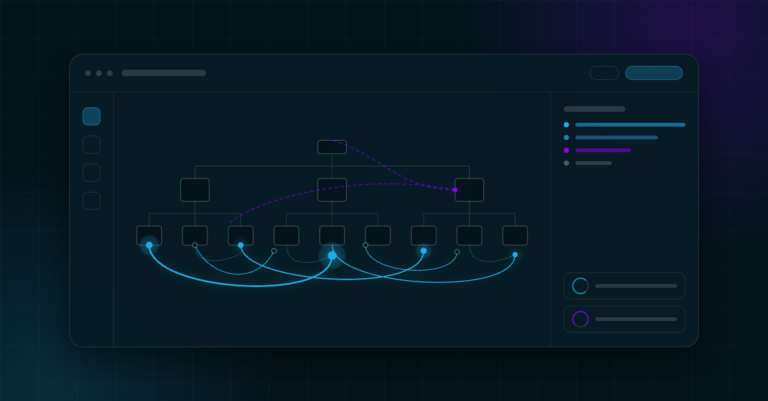
An org chart is great at describing reporting lines, but how is the work actually getting done or who’s making it possible to move forward?
Flux’s latest release notes: custom prompts, team-level DORA metrics, and AI-powered analysis of lead time findings, direct from the codebase.