.png)

Picture this: as you prepare for the next quarterly engineering review, you realize that new and changed priorities are stretching your team way too thin. You're making progress, but nothing's moving as fast as you'd like and expectations are high; trying to ground this in data isn't easy and risks placing further burden on your staff. An engineering analytics platform might be the solution.
But what exactly is an engineering analytics platform? Strip away the buzzwords, and you're looking at a system that connects your scattered development tools (like GitHub, Jira, Jenkins, and Slack) and transforms that data into actionable insights about how your team actually works. Think of it as Google Analytics for your engineering organization.
The value proposition goes beyond pretty dashboards. These platforms help you unblock the developer who's consistently blocked by code reviews, identify which types of features consistently blow up your estimates, and understand why Team A ships twice as fast as Team B despite similar skill levels.
In this guide, you'll learn how to evaluate engineering analytics platforms without getting lost in vendor marketing speak. We'll walk through real selection criteria that matter, implementation strategies that actually work, and how to measure ROI in concrete terms your CFO will appreciate. Most importantly, you'll understand how to transform your engineering operations from reactive firefighting to proactive optimization.
Engineering Analytics Platforms and the Modern Development Team
Why Modern Engineering Teams Struggle with Visibility
Managing engineering today requires data on both output and quality. With an array of disparate tools and significant manual work, teams have limited visibility into their development process. AI-native engineering analytics platforms are changing the way engineering teams work by improving both output and quality measurement while simultaneously requiring less time and effort.
The visibility gap in software development creates problems that compound over time: Sprint velocity swings wildly from 23 story points to 41 points with no clear explanation. Code reviews sit idle for days while developers context-switch between urgent bugs and planned features. Resource allocation becomes educated guesswork, leading to some teams drowning while others wait for work.
The cost of flying blind extends beyond missed deadlines. Developer burnout often stems from invisible inefficiencies: waiting for reviews, wrestling with unclear requirements, or constantly switching between projects. Technical debt accumulates in blind spots where code complexity grows unchecked. According to Puppet's State of DevOps Report, high-performing teams deploy 208 times more frequently than low performers, but most organizations can't identify what separates their high performers from the rest.
To close these visibility gaps, teams need better data—starting at the code level.
The Foundation: Code-Level Signals and Developer Patterns
Code analytics represents the foundation of engineering intelligence. Commit frequency reveals developer productivity patterns, but context matters more than raw numbers. A developer with fewer commits might be tackling complex architectural challenges, while high commit frequency could indicate either strong productivity or thrashing on poorly defined requirements. Code complexity metrics help identify technical debt hotspots before they become maintenance nightmares.
Team performance insights go beyond individual productivity to reveal collaboration patterns. Cross-team dependencies become visible when analytics platforms track which teams are consistently blocked by others. Communication effectiveness emerges from data about review response times, meeting frequency, and knowledge sharing patterns. Together, these code-level and behavioral insights reveal not just what is happening, but why.
Connecting Software Delivery to Business Impact
Deployment and release analytics focus on DORA metrics: deployment frequency, lead time for changes, mean time to recovery, and change failure rate. These metrics matter because they directly correlate with business outcomes. Google's DORA research shows that elite performers deploy multiple times per day with less than one hour of lead time, while low performers deploy monthly with lead times measured in months.
Traditional project management tools like Jira excel at task tracking but miss the engineering-specific context that drives real optimization. Jira tells you that a story is "in progress" but can't explain why similar stories take wildly different amounts of time to complete. It tracks story points burned down but doesn't reveal that your team consistently underestimates stories involving database migrations by 40%. To truly improve delivery speed and quality, teams need platforms that surface operational bottlenecks and code-level risks side by side.
Why Engineering Intelligence Platforms are Different
Engineering intelligence platforms connect code-level activity with project management data to reveal the full picture. They show that stories marked "ready for review" actually sit in review queues for 2.3 days on average, or that stories requiring coordination between frontend and backend teams take 60% longer than estimated. This granular visibility enables process improvements that project management tools simply can't surface.
Integration requirements extend beyond simple API connections. Effective platforms need to understand the semantic meaning of your development workflow. They need to distinguish between different types of commits, recognize when a pull request represents a bug fix versus a feature addition, and understand your branching strategy well enough to calculate meaningful cycle time metrics.
Try Flux's free trial now to see how we provide insights, help triage code issues, and saves development time.
How to Choose the Right Engineering Data Analytics Solution for Your Organization
Selecting the right engineering analytics platform requires careful evaluation across seven critical components, including:
- Organizational assessment: Understanding your current state
- Evaluation criteria definition: Establishing measurable success criteria
- Platform category analysis Choosing between enterprise, open source, or specialized solutions
- Technical integration requirements: Ensuring compatibility with existing tools and workflows
- Security and compliance considerations: Meeting regulatory and governance requirements
- Vendor evaluation processes: Conducting thorough due diligence
- Implementation planning: Managing trials and rollouts effectively
Each component presents unique challenges and trade-offs that compound across the entire selection process.
Operational Assessment
Assessment starts with honest evaluation of your current state. Team size drives platform requirements in non-obvious ways. A 15-person engineering team might need different analytics than three 15-person teams, even though the total developer count is the same. Organizational structure, communication patterns, and decision-making processes all influence which platform capabilities matter most.
Your existing tool ecosystem creates both opportunities and constraints. Teams using GitHub, CircleCI, and Datadog will have different integration requirements than teams using GitLab, Jenkins, and New Relic. According to VersionOne's State of Agile Report, the average engineering team uses 12.3 different tools across their development lifecycle, creating integration complexity that many organizations underestimate.
Evaluation Criteria Definition
Evaluation criteria need specific, measurable definitions. "Easy to use" means different things to different teams. Instead, define criteria like "new team members can create meaningful dashboards within two weeks of onboarding" or "platform requires less than 4 hours per month of maintenance from DevOps team." Weight these criteria based on your organization's actual pain points, not theoretical nice-to-haves.
Platform Category Analysis
Enterprise platforms like LinearB, Pluralsight Flow, and Code Climate Velocity excel in environments requiring sophisticated compliance, complex organizational hierarchies, and extensive customization. These platforms typically cost $15-50 per developer per month but provide enterprise-grade security, advanced analytics capabilities, and dedicated customer success support.
Open source solutions like Apache Superset with custom engineering dashboards appeal to organizations with strong internal DevOps capabilities and specific customization requirements. These solutions require significant upfront investment in configuration and ongoing maintenance but provide unlimited flexibility and zero per-user licensing costs.
The trade-off involves total cost of ownership calculations. While open source platforms eliminate licensing fees, they require dedicated engineering resources for setup, maintenance, and feature development. Organizations choosing this path typically have senior DevOps engineers who view analytics platform development as strategic work rather than operational overhead.
Specialized tools like GitPrime (now Pluralsight Flow) and Waydev focus on specific use cases rather than comprehensive analytics. These platforms excel in areas like developer productivity measurement or code review optimization but may require integration with additional tools for complete visibility.
Technical Integration Requirements
Technical integration requirements extend beyond API availability to data quality and processing capabilities. Real-time analytics sound appealing but may not justify the additional complexity for many use cases. Batch processing with hourly or daily updates often provides sufficient timeliness while reducing system complexity and costs.
Security and Compliance Considerations
Security and compliance considerations vary significantly by industry and organization size. Gartner research indicates that 73% of organizations consider data governance a top priority when selecting analytics platforms, yet many engineering teams underestimate the compliance implications of aggregating development data across multiple systems.
API availability determines long-term platform flexibility. Vendor lock-in becomes a real concern when platforms don't provide comprehensive data export capabilities. Evaluate not just current API functionality but vendor commitments to maintaining API compatibility during platform evolution. Once compliance, security, and data portability are accounted for, the next step is evaluating how well the vendor aligns with your development culture and workflow.
Vendor Evaluation Processes
Vendor evaluation requires structured processes that go beyond feature checklists. Demo sessions should include your actual data, not sanitized sample datasets. Request specific scenarios: "Show us how your platform would handle our deployment pipeline, which includes feature flags, blue-green deployments, and automated rollbacks."
Reference customer interviews provide crucial insights that vendor marketing materials can't capture. Ask specific questions about implementation challenges, ongoing maintenance requirements, and actual ROI measurements. Red flags include customers who can't articulate specific benefits or who mention significant ongoing customization requirements.
Implementation Planning
Trial periods need sufficient duration for meaningful evaluation—thirty-day trials rarely provide enough time for full integration and team adoption, while ninety-day pilots allow teams to experience the platform through complete sprint cycles and seasonal variations in development activity.
Engineering Analytics Platform Implementation: From Pilot to Production
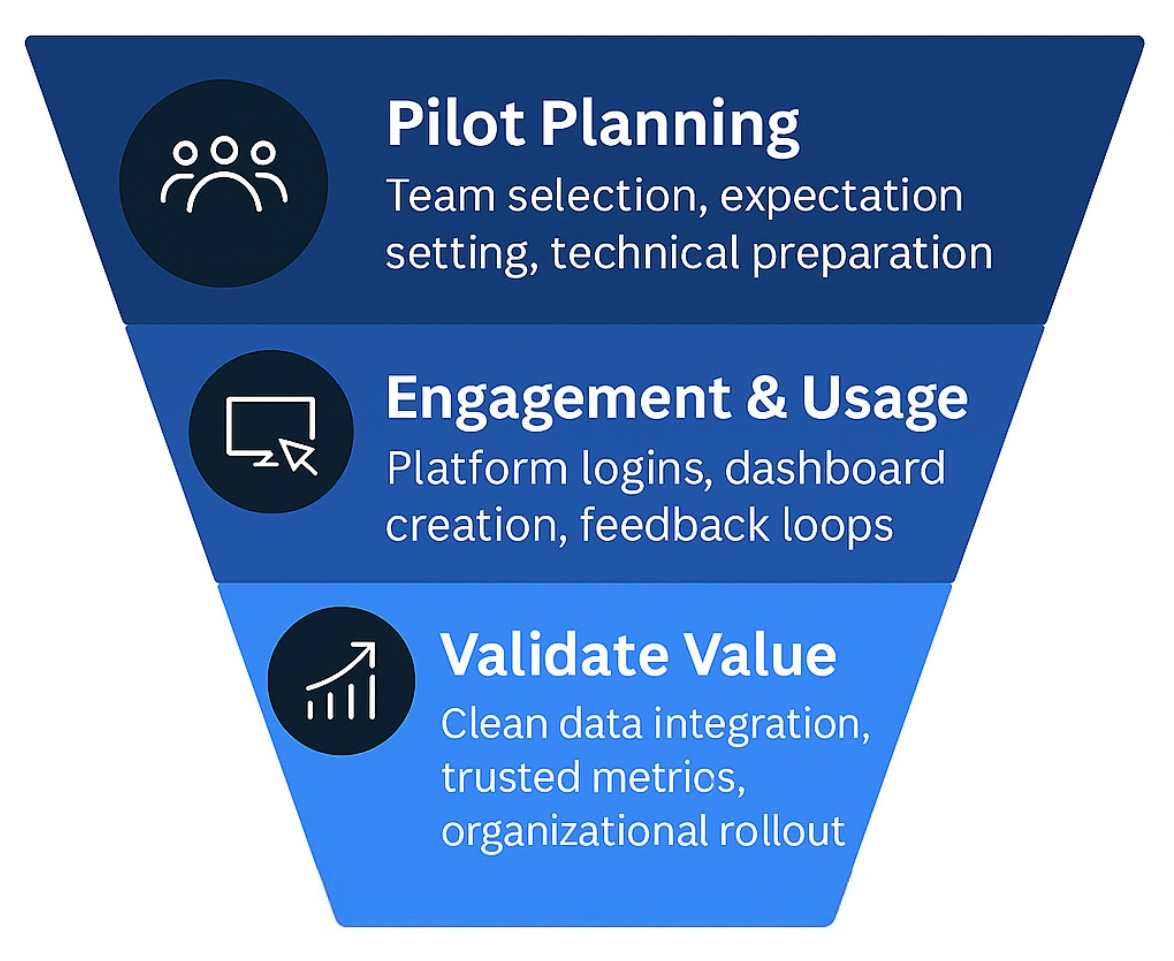
Strategic pilot design determines implementation success more than platform selection. Choose engaged early adopters who will provide honest feedback and help evangelize the platform, but avoid teams facing immediate crisis situations where additional complexity could backfire.
Pilot metrics should focus on leading indicators rather than lagging outcomes. Track platform usage rates, data accuracy verification, and user engagement rather than expecting immediate improvements in cycle time or deployment frequency. These foundational metrics predict long-term success and help identify integration issues before they become organizational problems.
Common pilot failures stem from unrealistic expectations and insufficient preparation. Teams expecting immediate transformation often abandon platforms before seeing results. Insufficient technical preparation—missing API keys, incomplete tool inventories, unclear data ownership—creates frustration that undermines adoption. Successful pilots require both technical readiness and change management planning.
Data Integration Considerations
Data integration and validation require systematic approaches that many organizations underestimate. Connecting Bitbucket, Jenkins, and PagerDuty sounds straightforward until you discover that your branching strategy doesn't align with the platform's assumptions about release workflows, or that your Jenkins job naming conventions make it impossible to automatically categorize build types.
Technical setup gotchas often involve authentication, rate limiting, and data synchronization timing. GitHub Enterprise instances behind corporate firewalls may require additional network configuration. API rate limits can cause data synchronization delays that make real-time dashboards misleading. Historical data backfill may take weeks for large repositories, creating temporary gaps in analytics.
Data quality verification needs specific checkpoints and validation processes. Compare platform metrics against known baselines: if your team deployed 47 times last month, does the platform show 47 deployments? If Developer A submitted 23 pull requests, does the platform count match? These basic validations catch integration issues before they undermine team confidence in platform accuracy.
Adoption and Training
Team adoption and training for engineering teams differs significantly from other departments. Training sessions for engineers should explain how the platform calculates metrics, what data sources contribute to each measurement, and why specific metrics matter for engineering outcomes.
Resistance often stems from privacy concerns and fear of surveillance rather than technology adoption challenges. It’s helpful to address these concerns directly by explaining data usage policies, showing how the platform helps rather than monitors individuals, and involving team members in defining which metrics matter most for their work.
How to Measure Implementation Success
Implementation success measurement requires both leading and lagging indicators. Leading indicators include platform login frequency, dashboard creation rates, and data export usage. These metrics show whether teams are engaging with the platform and finding value in the analytics capabilities.
Lagging indicators focus on engineering outcomes: sprint predictability improvements, reduced cycle times, and decreased time-to-recovery for production issues. DevOps Research and Assessment data shows that organizations with mature analytics practices achieve 2.5 times higher software delivery performance, but these improvements typically require 6-12 months to fully materialize.
Quarterly review processes should include specific KPIs and adjustment protocols. Track not just what the platform measures but how teams use those measurements to drive decisions. Are sprint retrospectives more data-driven? Do deployment decisions incorporate historical failure rate data? Are hiring decisions informed by team capacity analytics?
Try Flux's free trial now to see how we provide insights, help triage code issues, and saves development time.
Maximizing ROI from Your Engineering Analytics Platform Investment
Short-Term Wins
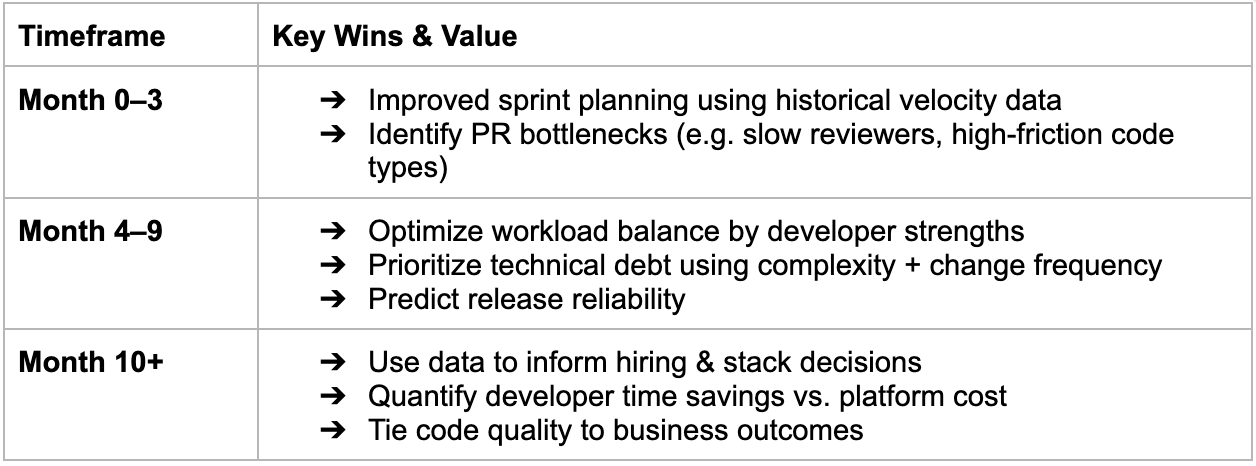
Immediate wins during the first three months focus on low-hanging fruit that demonstrates platform value without requiring significant process changes. Sprint planning accuracy improves when teams can reference historical velocity data adjusted for team composition, holiday schedules, and project types. Instead of guessing that the next sprint will mirror the last sprint, teams can make informed commitments based on comparable historical periods.
Pull request bottleneck identification provides another quick win. Analytics platforms reveal patterns invisible to daily workflow participants: certain types of code changes consistently require longer review cycles, specific reviewers become bottlenecks during particular project phases, or pull requests submitted on certain days of the week receive faster attention.
Medium-Term Improvements
Medium-term optimization during months four through nine enables more sophisticated process improvements that require team behavior changes and workflow adjustments. Team productivity patterns become clear enough to guide workload balancing decisions. Analytics reveal which team members excel at different types of work, optimal team sizes for different project types, and collaboration patterns that predict project success.
Technical debt prioritization transforms from reactive firefighting to strategic decision-making when code complexity metrics guide maintenance investments. Instead of fixing whatever breaks loudest, teams can identify code areas with high complexity, frequent modification, and business criticality—the intersection that represents the highest-value refactoring opportunities.
Release predictability improvements emerge from deployment analytics that help teams understand their own delivery patterns. Teams learn that releases involving database migrations require 40% more testing time, that releases scheduled on Fridays have higher rollback rates, or that releases coordinated across multiple teams need additional buffer time for integration testing.
Long-Term Value
Long-term strategic value emerges after month ten when analytics data supports high-level organizational decisions. Engineering hiring decisions become more precise when data reveals actual skill gaps rather than perceived needs. Technology stack decisions gain quantitative support when productivity metrics compare different frameworks, languages, or tools across similar projects.
Developer time savings calculations should account for both direct time savings and indirect benefits. Direct savings include reduced time spent in status meetings when dashboards provide visibility, faster debugging when deployment analytics highlight probable causes, and more efficient code reviews when complexity metrics guide review focus.
Automating Software Capitalization
As you probably know, new features and architectural improvements qualify for R&D credits, while bug fixes and maintenance don't. Most organizations struggle to differentiate between capitalizable new feature development and non-capitalizable maintenance work, leaving millions in tax benefits unclaimed. Engineering analytics platforms automatically categorize development work for R&D tax credit accounting.
For a typical $50 million company with a 30-person engineering team, improved classification can identify $200,000-500,000 in additional annual R&D tax credits, enough to pay for the platform investment several times over. CFOs love this "free money" that requires no operational changes, just better documentation of existing work.
Future-Proofing Your Engineering Analytics Platform Strategy
AI-powered predictive analytics represents the next evolution in engineering intelligence. Current platforms primarily provide descriptive analytics (what happened) and diagnostic analytics (why it happened). Emerging capabilities include predictive analytics that forecast project delays, identify developers at risk of burnout, and suggest optimal team compositions for upcoming projects.
Developer experience measurement frameworks are gaining traction as organizations recognize that productivity metrics without satisfaction metrics provide an incomplete picture. Future platforms will integrate traditional engineering metrics with developer sentiment data, career progression tracking, and work-life balance indicators to provide holistic team health assessments.
Real-time coaching and suggestion capabilities transform analytics platforms from passive reporting tools to active development assistants. These systems might suggest optimal reviewers for specific pull requests, recommend refactoring priorities based on upcoming feature requirements, or alert teams to potential integration conflicts before they cause delays.
Platform evolution planning requires ongoing evaluation of vendor roadmaps and competitive landscapes. Vendors focusing solely on metrics reporting may struggle to compete with platforms offering predictive capabilities and automated insights. Organizations should evaluate vendor investment in machine learning capabilities, API evolution commitments, and integration with emerging development tools.
Conclusion
Data-driven engineering leadership isn't optional anymore. While your competitors optimize their development processes with concrete insights, continuing to manage engineering teams based on intuition and anecdotal evidence puts your organization at a fundamental disadvantage. The engineering analytics platform market's rapid growth reflects this reality: thousands of engineering leaders are already using data to make faster, more accurate decisions about their most valuable assets.
The compound benefits of early platform adoption extend beyond immediate process improvements. Organizations that establish analytics capabilities now will have years of historical data to guide future decisions, mature processes for translating insights into action, and teams comfortable with data-driven development practices. This foundation becomes increasingly valuable as engineering organizations grow and face more complex coordination challenges. But even with the best tools, successful outcomes still depend on how those tools are used.
Remember that engineering analytics platforms are tools that amplify human judgment rather than replace it. The most successful implementations combine quantitative insights with qualitative understanding, using data to inform decisions while maintaining focus on the human elements that make engineering teams truly effective. Your platform should make you a better engineering leader, not just a more informed one.
Check out our company LinkedIn here!